Preview Panel - Benchmark Feature
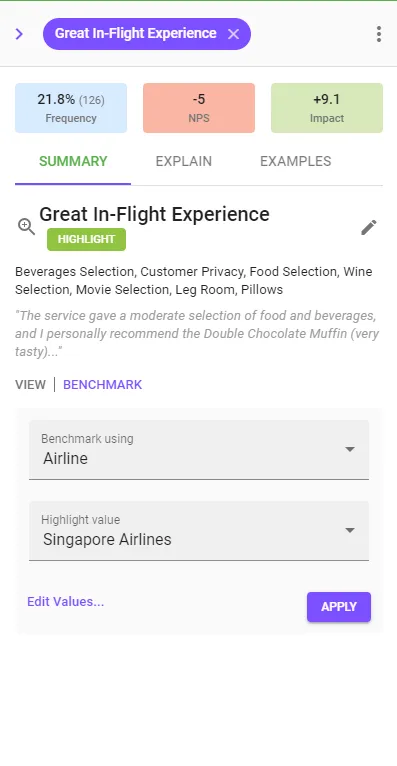
When previewing a Concept or Report Insight the Summary Tab of the Preview Panel has an additional option called ‘BENCHMARK’.
![]()
This feature can be used to quickly compare how the selected pattern is performing across any categorical dimension in your Dataset.
e.g.
I have identified a Highlight in the Airlines data where passengers talk about having a Great In-Flight Experience. In which airlines is this mentioned most? How does my airline, ‘Singapore Airlines’, rank?
How do I use the Benchmark feature?
- Select the ‘Benchmark using’ attribute. This is the dimension that you want to compare the selected pattern across.
- (optionally) Select a value that you want to highlight. This will be the value that is ranked.
- Click APPLY
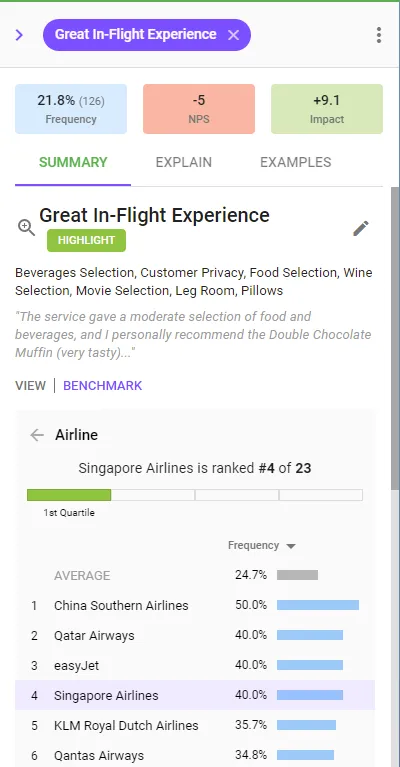
- View the ranked list of results. If a Highlight Value was selected the rank and quartile of that value will also be displayed.
Things to note:
- Use the ‘Edit Values…’ link to reduce the set of values to rank against in the Benchmark dimension
- Having a high rank for a Painpoint means it occurs less often
- Frequency % values are calculated as a percentage of the frequency for that value rather than the overall frequency. This allows values with different total frequencies to be compared.
- When ranking by a score, note that 0 frequency values have no score so cannot be included in the rankings.
- The Average is calculated as the mean of the values that are being ranked.