Navigating a Discovery
A Discovery consists of a number of patterns that you can sort, filter, export and view.
Analysis Result Overview
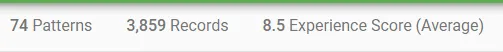
- Number of Patterns that were discovered in the data you selected for this Analysis – Ipiphany returns up to 100 patterns with the largest Impact on your selected measure.
- Number of Records that were in your analysis selection – by default pattern Frequency will be displayed as a percentage of these records.
- Overall Measure value of your selected Measure for this data selection - you can compare the Measure for a specific pattern to the overall value.
The Discovered Patterns
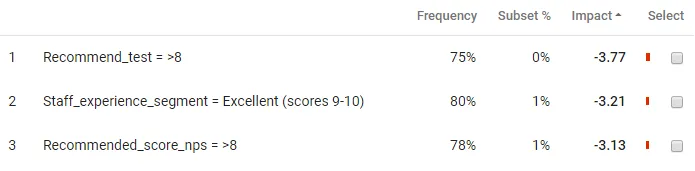
Each pattern is summarised in a row in the results table and is described by one or more driver values e.g. First Contact Resolution = No
Patterns are display with the follow statistics:
Frequency – Is the % of the records you selected for this Analysis that match this pattern (click on the cog icon to change to actual counts).
Measure e.g. Net Experience, Average
Comparison - Displays a Coloured Bar to indicate the relative strength and sign of the Comparison Metric
- Red – Indicates a negative Comparison
- Green – Indicates a positive Comparison